USDA Updates Plant Hardiness Map
The United States Department of Agriculture (USA) recently unveiled a new iteration of its Plant Hardiness Map for the United States. The new map shows that the contiguous United States is about 2.5° F. warmer than the previous 2012 map, meaning about half the country has shifted into another half-zone. It also means that many sections of the country have gotten warmer since 2012.
The Plant Hardiness Map is a proven tool for nursery growers, farmers, gardeners, and homeowners. Providing a standard for determining which perennials have a good chance of surviving in an area, the map helps growers zero in on the right plants, shrubs, and trees for a zone. Homeowners, for example, can use the map to choose the best trees, shrubs, and plants for their property.
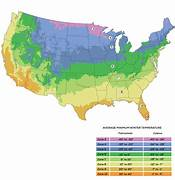
The map divides the U.S. into 12 zones, with Zone 1 being the coldest and Zone 12 being the warmest. Heat Zones are a relatively new map idea. The zones reflect the area’s average minimum temperatures during the winter. The map also has several new features, such as map widgets, which let you zoom into your current t location and zoom out to the map’s default view.
While most of Rhode Island falls within the plant hardiness zone 6a, it extends from 5b to 7a, with its average annual minimum temperature for the area ranging from -10°F to 5°F. The state’s coastal location—with its northern and western regions being cooler than its southern and eastern areas—contributes to this placement.
Visit this USDA website page for a copy of the map and instructions on how to use it as a guide to choosing the best plants for your area.