How to Use the USDA’s New Plant Hardiness Map to Select the Right Plants for your Location
The United States Department of Agriculture (USA) recently unveiled a new iteration of its Plant Heat Zone Map for the United States. The new map shows that the contiguous United States is about 2.5° F. warmer than the previous 2012 map, meaning about half the country has shifted into another half-zone. It also means that many sections of the country have gotten warmer since 2012.
Also known as the Plant Hardiness Map, this map is a proven tool for nursery growers, farmers, gardeners, and homeowners. Providing a standard for determining which perennials have a good chance of surviving in an area, the map helps growers zero in on the right plants, shrubs, and trees for their location. Homeowners, for example, can use the map to choose the best trees, shrubs, and plants for their property.
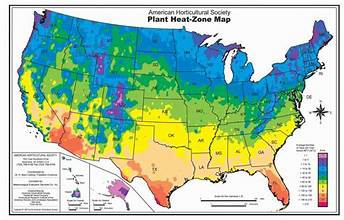
The map divides the U.S. into 12 zones, with Zone 1 being the coldest and Zone 12 the warmest. Heat Zones are a relatively new map idea. The zones reflect the area’s average minimum temperatures during the winter. The updated map also has several new features, such as map widgets, which let you zoom into your current t location and zoom out to the map’s default view.
Valuable Tool for Growers
The Hardiness map is a valuable tool for homeowners, commercial growers, and dedicated gardeners, enabling them to pick plants well-suited for the location’s weather conditions. That is critical for Rhode Islanders because of its difficult winters. Rhode Islanders now have a tool that helps them determine trees, shrubs, and other plants have a greater likelihood of
surviving New England winters.
While most of Rhode Island falls within the plant hardiness zone 6a, its complete hardiness zone extends from 5b to 7a. This area offers average annual minimum temperature ranging from -10°F to 5°F. The placement reflects the state’s coastal location—with its northern and western regions being cooler than its southern and eastern areas.
Below are more specifics on what this means for Rhode Islanders:
- Zone 5b is the coldest in the state. Its average annual minimum temperature is -10°F to -5°F. The zone covers the northernmost part of the state.
- Zone 6a encompasses the largest part of the state. It features an average annual minimum temperature is -5°F to 0°F. The zone includes much of the state’s interior.
- Zone 7a has an average annual minimum temperature is 0°F to 5°F, the warmest section of the state. It’s located in the southeastern part of the state.
How to Use the Map
Using the map is simple and straightforward. Start by entering your zip code to find your location on the map. Click on this section of the map. The result tells you your Plant Hardiness classification. If you want to access the map in a different resolution, toggle down to the “Maps Downloads” tab at the page’s top. You can even print copies of these maps. The map also has several interactive features called “widgets.” They are located just below the Zip Code search on the map.
The widgets support the usual map tools for zooming in to a specific location and returning to the default map view. The layers widget, represented by the stack of papers symbol, lets you turn off or on any of the map’s layers, including roads and place names. Meanwhile, the slider widget lets you adjust the transparency of the selected layer to boost visualization. It also allows you to adjust the transparency of the selected layer to enhance visualization.